ALGORITHM METHODOLOGY

The Science of Cyber Risk Propagation & Financial Impact

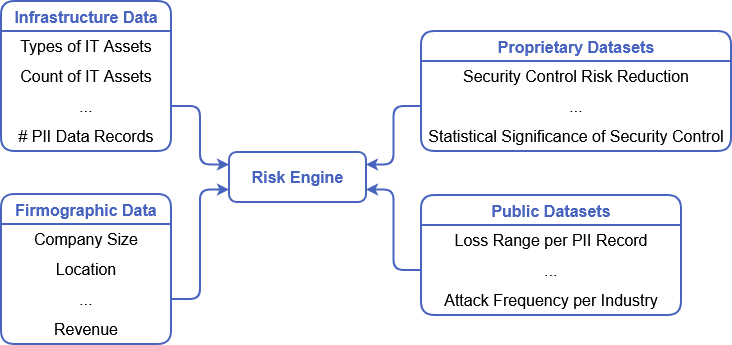
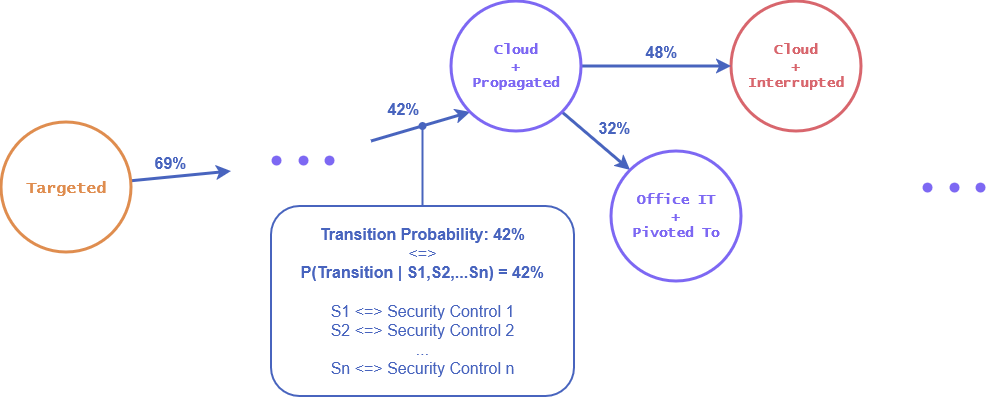
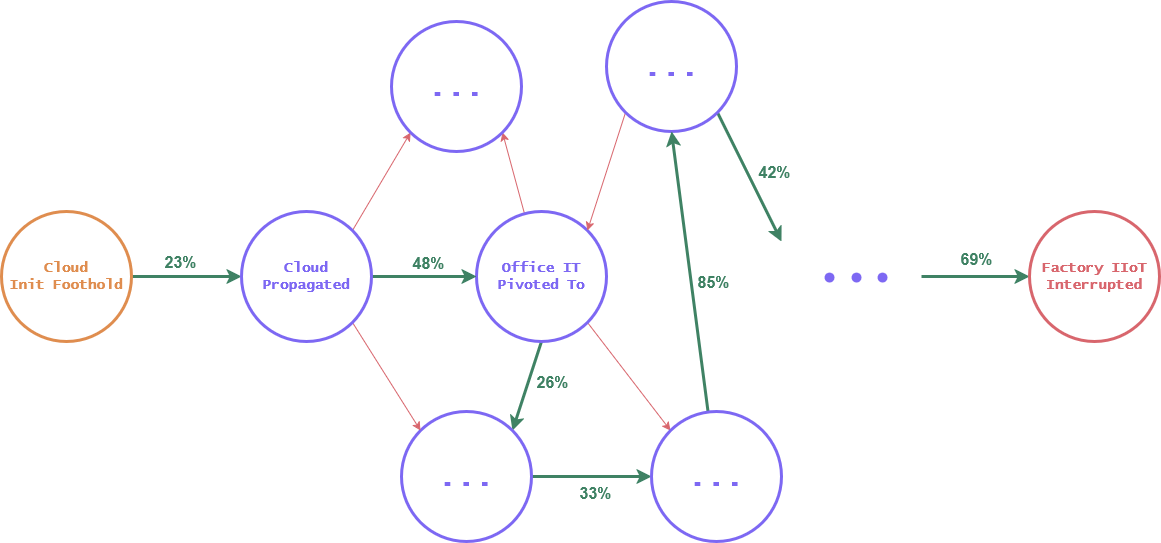
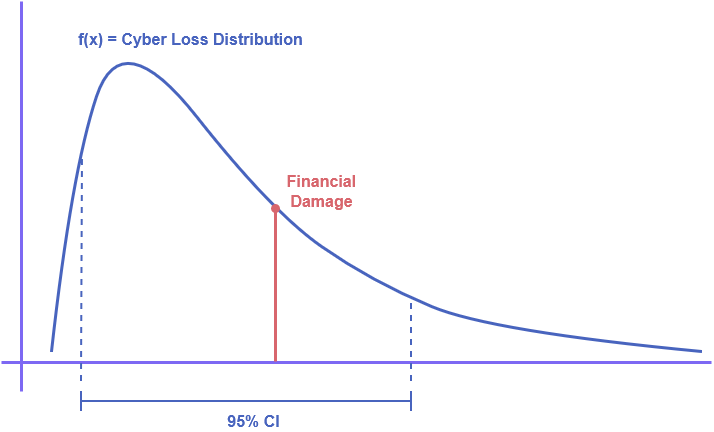
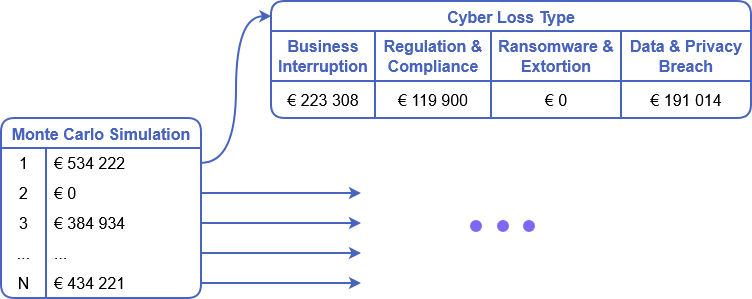
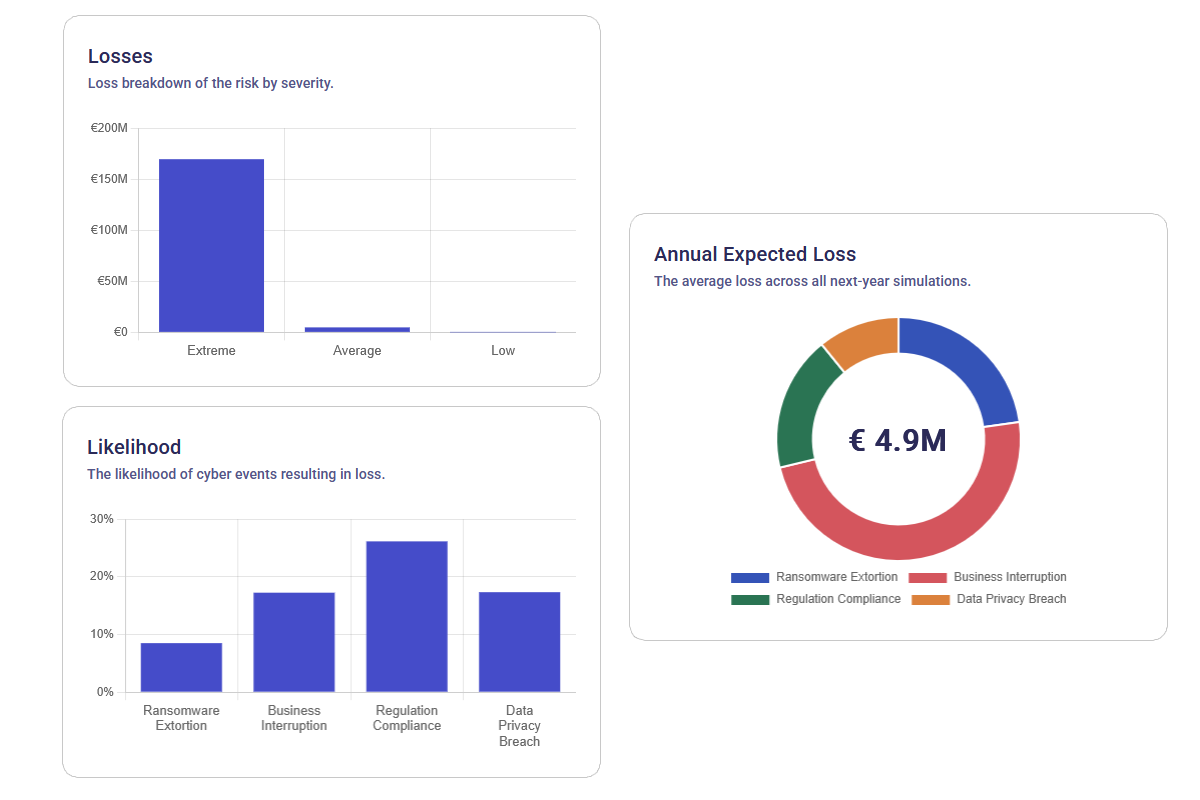
Understand how our algorithm works to move beyond static scoring. Arakt uses stochastic modeling and advanced attack-path simulations to map how cyber risk cascades through your infrastructure, quantifying your exposure with actuarial precision.

Get Started
The Science of Cyber Risk Propagation & Financial Impact

The Quantification Pipeline

A six-stage process translating technical vulnerabilities into business-ready financial intelligence.

1. Telemetry & Data Intake

The engine ingests your specific firmographics, infrastructure topology, and security control efficacy. This is enriched with global threat intelligence and proprietary actuarial datasets on record-level loss magnitude.

Regional & Sector-Specific Loss Data (EU/US)

Real-world PII/PCI/PHI Sensitive Data Valuations

1. Telemetry & Data Intake

2. Risk Propagation Graph

We construct a dynamic risk graph that mimics real-world adversary behavior. The model maps every potential connection between assets, assigning transition probabilities based on your implemented security controls.

Context awareness based on IT asset group type

MITRE ATT&CK & Cyber Kill Chain Alignment

Control-Weighted Probability Modeling

2. Risk Propagation Graph

3. Stochastic Attack Traversal

Using a 'Random Walk' algorithm, we simulate thousands of non-linear attack scenarios. The engine traverses the graph, testing how far an adversary can move before triggering a high-impact 'Damaging Node.'

Simulated Movement Paths

Pivot Point Analysis

3. Stochastic Attack Traversal

4. Inverse Log-Normal Financial Distribution

Once a damaging node is reached, we calculate financial loss using an inverse log-normal distribution. This power-law model is critical for capturing 'Long Tail' risk—those low-frequency but catastrophic loss events.

Statistical Power-Law Modeling

Black Swan & Tail-Risk Quantification

4. Inverse Log-Normal Financial Distribution

5. Monte Carlo Convergence

The simulation runs tens of thousands of times per workspace. This massive-scale Monte Carlo iteration ensures that individual statistical anomalies are filtered out and the final risk results converge into a stable, reliable mean.

10,000+ Automated Simulation Iterations

Statistically Stable Risk Baselines

Confidence Interval Tracking

5. Monte Carlo Convergence

6. Strategic Intelligence Output

The final raw data is translated into executive-level insights. Users receive a clear view of their annual loss expectancy, optimal insurance coverage limits, and prioritized remediation plans based on ROI.

Loss Exceedance Curves (LEC)

Deductible & Limit Optimization (Insurance)

Financial ROI on Security Investments

6. Strategic Intelligence Output

Send the Cyber Risk Department into the Future!

Start today and transform the way your company views cyber risk!

Get Started

Discover More of Arakt

Learn what else the platform can do.

Relevant Resources

Take a look at the following knowledge hub resources for an even better understanding of each topic.